Wednesday, September 2, 2015

Q2 2015 GDP FOR CANADIANS. CANADIANS HAVE BEEN SUFFERING RECESSION FOR MUCH LONGER THAN RECENT PROPAGADISTS CLAIM

Yesterday, the John Shmuel of the Financial Post reported that Canadians have entered a "technical recession" — two quarters of negative growth. Shmuel went on to report that most Canadian economists would claim Canadians aren't experiencing a recession because the unemployment rate seems steady and wages in current Canadian dollars seem to be growing.

Of course, Schmuel's beliefs are silly.


Right now, Canadians are feeling the effects of the recession of the Chinese and the depression of the Americans.

The Canadian economy has shrunk -34.9% in True Dollars™ since Q2 2011.


Read more ...

Tuesday, June 2, 2015

JUNE 2015 MANUFACTURERS' SHIPMENTS, INVENTORIES, AND ORDERS — NEW ORDERS. IT'S ALMOST ALL DARK WITH A FEW RAYS OF HOPE.

So, the worker bees at the Bureau of the Census have released the April data for the June 2015 Manufacturers' Shipments, Inventories, and Orders report.

After putting the data in True Dollars™, for new orders, the change from the previous month looks bad along with the change from the previous year as well as from five years ago. Only the change from the previous quarter looks good.


There are a few bright spots, though. It is from here that a basis of true recovery likely is forming.

The industries that are showing consistent bettering are construction materials, electric components, industrial machinery, material handling, ferrous metal foundries, iron and steel mills.


Read more ...

Tuesday, May 26, 2015

NEW RESIDENTIAL SALES FOR APRIL 2015 SHOWS FULL RECOVERY IS STILL A WAYS OFF. NEW HOUSES SELLING AT 34% DISCOUNT ON AVERAGE

Back on May 19, I showed how the trend in new residential construction looks good. However, I cautioned that Americans have a long way to go until we have a solid economy with most Americans standing upon sound footing. It's likely, residential construction is two to three years away from having recovered.


Today, the Bureau of the Census released the latest New Residential Sales report for April, 2015.


True prices continue to fall reflecting the true state of credit in the USA. Average true prices as calculated in True Dollars™ are now lower than the low true prices hit during the early Clinton years after Clinton inherited the mess from the elder George H.W. Bush.

New houses sell at a 34% discount to the average price calculated from 1963 through 2001.


True median prices are worse today than during the early days of Richard Nixon. New house prices sell at a 29% discount to the average median sales price.


Builders' confidence reveals mixed signals.


Yet, builders seem to be speculating wildly still.


The road to full recovery is a long, hard one.

Read more ...

Friday, May 22, 2015

LATEST TRANSPORTATION DATA REVEALS AN ECONOMY STILL STRUGGLING TO LEAVE BEHIND THE GREATEST DEPRESSION

Each month the U.S. Bureau of Transportation Statistics of the Department of Transportation releases data collected about movement of people and goods conveyed by airplanes, trains, ships and pipelines. By putting that data into context, we can catch a glimpse of what is happening in the economy.


These charts reveal that perhaps we're in the early stages of lift off from the bottom.


It's getting worse for rail carriers.


And it's getting worse for sellers of scheduled passenger flights for domestic and international travel.


And it is clear that water haulers slipped between 2011 and 2014 after the 2009 lows.


When the poor aren't working, they can't travel hardly anywhere.


And when people are poorer, they don't fly and drive, they ride subsidized Amtrak.


As well, airline enterprisers have cut their flights, though this seems to be bettering.


And now let's look at the good. Natural gas consumption is up. Likely, this is a result of fracking for oil.


And intermodal traffic is way up.


Read more ...

Thursday, May 21, 2015

EXISTING HOME SALES REVEALS OMINOUS BLACK CLOUD OVER THE U.S. ECONOMY. STILL THESE ARE THE BEST TIMES TO BUY RESIDENTIAL REALTY

While some await the Census Bureau workers' next release of New Residential Sales data on May 26, 2015, the National Assoication of Relators have released Existing Home Sales data. The story looks bleak.


Always, numbers without context lack meaning.

While Existing House Sales looked to be bettering from the low of Q4 2008, that bettering stopped August 2013. Since then the trend has been worsening.


In spite of the worsening state of existing house sales, if you have the income, likely these are among the best days to buy a house in decades.


However, far too many Americans cannot swing a mortgage to buy a house. That, my readers, is the biggest problem vexing the economy.


There are many could-be buyers, but few would-be buyers because so few have the means to swing a mortgage. And yet, True Dollar™ prices run near 50% off.


The inane policy of Quantitative Easing impaired extant capital. To restore returns to capital bought with credit, enterprisers had to cut labor.

After all, wages arise solely from capital. Absent capital, there can be no wages.

Not until all of the impaired capital has been written off, can enterprisers begin to undertake new capital on much lower interest rates. Yet, once enterprisers can, new capital formation will give rise to wages.

We're catching glimpses of this dynamic of capitalism expressed in the labor markets. First there was massive layoffs, unemployment and the need to collect SNAP food welfare from Congress. Of late, there has been a steady decline in True Unemployment in the working age population.

Enjoy one from one of my all-time faves, The Boys!


Read more ...

Sunday, May 10, 2015

CONSTRUCTION SPENDING REPORT SHOWS THE DEPRESSION STATE OF THE U.S. ECONOMY

So a week ago this past Friday, on May 1, 2015, the Census Bureau of the Department of Commerce released the Value of Construction Put in Place Survey (VIP). The VIP is a report of  provides monthly estimates of the total dollar outlay of construction work in the U.S.A.


The survey covers construction work done each month on new structures or improvements to existing structures for private and public sectors. Data estimates include the cost of labor and materials, cost of architectural and engineering work, overhead costs, interest and taxes paid during construction, and contractor’s profits.

After removing the effects of monetary accretion, chart after chart reveals the sorry state of construction in the USA.

Soon, I shall be releasing a special web service that has all of the charts derived from this survey, updated automatically. This service will have all of the key economic indicator surveys, price adjusted so you can understand reality.

For now, though, I want to share with you a few key charts from the VIP.


One of the few bright spots on construction spending can been seen in private enterprise spending on manufacturing.


Read more ...

Thursday, May 7, 2015

ELECTRICITY AND GASOLINE PRODUCTION ARE WAY DOWN. BUT BEA AGENTS CLAIM THE ECONOMY IS GROWING.


On Wednesday, April 29, 2015, workers at the Bureau of Economic Analysis of the Department of Commerce told the world that after adjusted for price changes, real gross domestic product increased at an annual rate of 0.2% in Q1 of 2015.

All of the world's most popular financial bloggers as well as popular Ph.D. academicians working in the field of economics parroted that silliness, which makes me wonder why anyone reads and believes anything they publish.

Of course, the BEA report is little more than a work of foolery. True GDP — GDP after removing the effects of monetary accretion — shows the U.S. economy continues to shrink during Americans' Greatest Depression.

From Q4 2014 to Q1 2015, True GDP shrank -2.1%. Year-over-year, True GDP has shrunk -3%. And since peak True GDP driven up the by the Alan Greenspan-Ben Bernanke Inflation Bubble, the biggest credit bubble in the history of mankind, True GDP has shrunk -44.9%, shockingly so.

How could anyone believe the economy is growing when energy usage by each American has fallen as much as it has?


The recent gasoline numbers prove interesting. With a substantial drop in prices, Americans bought more gasoline over the last two years. However, that trend has stopped over the last six months. Americans bought less gasoline last month than the average over the last six months.


Everyone should listen to me because ...


Read more ...

Tuesday, May 5, 2015

FEWER MILES DRIVEN FOR EACH AMERICAN. THE ECONOMY IS DRIVING IN THE SLOW LANE WITH ITS FLASHERS ON.


Workers at the Federal Reserve give you this chart every month. If you relied on
this chart, you would think it reveals something positive. After all, it shows that vehicle miles driven are near an all-time high.


However, the chart lacks context. As I teach always, without context, explanation is meaningless.

It is not the total miles that count, but the total miles each American 16 and older that counts.


Driving peaked between 2001 and 2005.


Read more ...

Monday, May 4, 2015

COMMERCIAL BANK CREDIT FALLING STILL. REPORTS OF A US ECONOMY EXPANSION ARE WRONG.

Commercial banking has been the mainstay of the economy since the mid 1800s. When bankers extend enough of their bank credit, takers produce more in hopes of earning profits. Most times, under prudent credit lending, the economy expands.

In the days of money — coined metal by weight and fineness — bank credit expansion was easier to detect as ever more bank notes would circulate from banks of issue. When prices would get pushed up quite high, prudent men knew that a bank crisis would be forthcoming.

Today, it's much harder to see such things as no one has money. Today, everyone only has cash, which is evidence of deposits in circulation, as well as deposits that can get negotiated by check or so-called electronic transfer.

When commercial bank credit is falling, there is no way the economy could possibly be expanding. And yet, true credit is falling while politicians and Federal Reserve bankers tell you an expansion is underway.


The commercial picture doesn't look good.


The consumer picture looks as bleak.


Residential realty looks bad. Likely, it's a great time to buy a house, if you can as true prices likely are quite low, historically.


In fact, the whole realty part of commercial banking is quite bad.


Read more ...

AMERICANS LIVE IN THE GREATEST DEPRESSION STILL. NO RECOVERY. NO EXPANSION. IT'S ALL BEEN A PACK OF LIES.

For those who read Bizarro Theater, I ask you to spread the word about this important work.


Back on April 14, 2015, I released the charts from the U.S. Census Bureau on Advance Monthly Sales for Retail and Food Services for March 2015 adjusted for inflation (see: ADVANCE RETAIL SALES SHOW EIGHT YEARS OF LIES. WHAT RECOVERY? DEPRESSIONS NEVER LASTED THIS LONG WHEN AMERICANS HAD MONEY.)

In chart after chart, you see the true picture of retail. There isn't a sector of retail that has not experienced a decline in sales from peaks happening between Q4 2007 and Q3 2008. Some sectors like grocery retailers and food and beverage retailers hit their respective peaks in Q4 2000.

Cars, other vehicles and parts sales for such hit a peak way back in Q4 2001. It should not surprise then why car makers begged for bailouts.

And everywhere else you can look from manufacturers' new orders and personal income to savings and investment, you see the same pattern of downward curves. In short, the economy has been shrinking for years in spite of the lies from Janet Yellen, her predecessor Ben Bernanke, President Obama and many TV blabber heads.

The Federal Reserve System and its workers have failed consistently at managing the economy. They cannot do it. 

What execs at the Federal Reserve System are successful at doing is colluding with successive U.S. Congresses to keep Americans from agitating for a return to money — coined metal by weight and fineness. Having legal tender bank notes and checkable deposits as the only means of debt settlement to U.S. Congress keeps banking going in spite of the needs of Americans.

First up is GDP. True GDP is down 2.1% from Q4 2014 to Q1 2015.


Here is the state of acquiring capital for production. If the economy were growing, this curve should be sloping upward to the right.


Here is what manufacturing looks like.


And all of those charts and many more that will be published with frequency and made available free to those who subscribe to various priced-products all show the same downward trend.

Spending by Americans constitutes more than 2/3's of the economy. Americans true disposable income keeps falling.


Therefore Americans can't spend.


And enterprisers can't earn.


And few can save on falling true incomes.


And few can profit on falling incomes.


But U.S Congress' Obamacare is increasing Medicaid income. And that readers, is the crowning achievement of six years of Obama and his congresses.

Read more ...

Tuesday, April 14, 2015

ADVANCE RETAIL SALES SHOW EIGHT YEARS OF LIES. WHAT RECOVERY? DEPRESSIONS NEVER LASTED THIS LONG WHEN AMERICANS HAD MONEY.

Well, the U.S. Census Bureau has released the Advance Monthly Sales for Retail and Food Services for March 2015. Suffice to say, the propagandists report that retail sales are up. Always, they do. That is easy enough to do under a regime of ongoing cash accretion.

For eight years, agents of propaganda for the President, the Congress, and the Federal Reserve have told you there was a crisis that needed urgent action. And after the crisis had been handled, these same agents told you an economic recovery had been underway.


Well, all of that has been outright lies, big lies, whoppers of epic proportion. The crisis was the making of Congreses and commercial bankers precisely because bankers came to rely on mortgage-backed securities created by the agents of Congress, Freddy Mac and Fannie Mae, as reserves from which to meet liabilities.

Politicians, appointed officials, presidents and idiot economist academicians have lied to your faces about the crisis. And after dealing with the crisis, these same despicable, unmanly cowards have lied to you continuously about a fake recovery.

Because you are an adult,  you should expect politicians to lie. Idiot economist academicians lie mostly because they are too stupid to know their doctrines, which they have accepted as dogma are quite false.

As Americans, we are stuck with liarbirds.

I have shown you these lies in these stories and many more:

The foregoing have charts on true GDP, true bank credit, corporate true profits and true bank clearings. You should read those to see the charts at least. You can use these charts to steer your way through commerce. 

There hasn't been any recovery because bankers at the Federal Reserve do not understand commerce at all. Economist academician Ben Bernanke, a guy who never worked in a for-profit industry as an adult, indeed knew not what he was doing with his stupid Quantitative Easing. And his follower, Janet Yellen is little better.

By suppressing interest rates and thus cheapening credit, Bernanke and Yellen have killed the the return to capital for those with extant capital paid for with credit at higher rates borrowed upon expectation of higher prices.  This has resulted in unnecessarily lengthened, high unemployment followed by capital growth restriction and thus true wage growth impairment.

In short, both Bernanke and Yellen have impaired capital. Without sound capital, wages can't get paid. Without wages, few can consume to any extent.

Look at these charts. These charts support exactly that. None of these charts dealing with the advance monthly sales for retail and food services reveals any recovery. All the charts show ongoing decline.

Total Retail and Total Restaurants


Cars, Trucks, other Vehicles, Parts, and Gasoline


THE BRIGHT SPOT: Non-Store Retailing

Although non-store retailing (Internet shopping, mostly) has fallen since the peak, it hasn't fallen off as bad as every other sector of retailing.


When Americans had money — coined metal by weight and fineness — never did trade depressions last as long. It's only since the advent of the Federal Reserve and the replacement of money with cash as legalized tender that depressions have lasted this long. Mortgage-backed securities issued by the agencies of Congress only have made banking and the economy worse.


Read more ...

Monday, April 13, 2015

ECONOMIC EXPANSION? RECOVERY? SHUT UP ALREADY AND STOP LYING ABOUT ANY RECOVERY.MUCH LESS ANY EXPANSION.


As I showed back in April in AMERICAN CORPORATE PROFITS STILL IN DECLINE AND STILL TOO HIGH. SEE THE TRUE PICTURE, corporate profits are falling. Never does the economy expand on falling true corporate profits.

As I wrote back in November 2014 in THE SECRETS OF AUTOMATED CLEARINGS, GDP AND THE ECONOMY. RECOVERY? WHEN?

Commercial banking is what gives rise to any advanced economy. In spite of popular misguided hatred for bankers, without commercial banking, you would be living at a bare subsistence. Nothing that you know would exist. 
Until True Commercial Clearings begin to rise, no one should expect the economy to be sound. Until True Government Clearings begin to rise steadily, no one should believe an expansion is under way.
There is no reality to any claims of the USA economy in expansion. It's not even in recovery. The economy has been contracting every year since peak True GDP of Q4 2007.

Commercial banking clearings activity fails to support any propaganda about the economy pushed either by those of the Obama Administration or by those of the Federal Reserve.

Back in Q2 2013, it looked as if for moment, at long last, a true recovery could have been underway. That didn't hold. The same kind of head fake happened in Q3 2014.


That government clearings is about GDP reveals welfare spending support. That government clearings is in decline reveals fewer true taxes collected on falling true GDP.


The Federal Reserve ought to be required by Congress to provide Americans this data on monthly rather than quarterly and long after the quarter expires.

As well, it would be great if the likes of Obama and Yellen weren't such cowardly immoral cretins. If only they could mature, get tough and begin telling truth to all, that would be great.
Read more ...

Sunday, February 1, 2015

DAMMIT JANET. THE USA ECONOMY RECOVERY HAS BEEN DERAILED YET AGAIN.


Back on January 5, 2014, in STATE TAX RECEIPTS LAG TRUE GDP. IS THE RECOVERY ON OR NOT?, I said, taxes are lagging behind GDP precisely becaues profits had been lagging the two quarters of True GDP growth. And I warned,
However, unless those curves at least flatten and then swing up within the next few quarters,  it is hard to see how the two quarter positive turn in True GDP can sustain.
The month before that, I revealed what could have been the start of the USA economy advance in THE USA ECONOMY ADVANCE LIKELY HAS BEGUN AT LONG LAST.

Well now, it doesn't look as if an advance can be sustained under the present commercial state.

On Friday, January 30, 2015, the U.S. Bureau of Economic Analysis released the Q4 2014 GDP data. In their release, workers of the BEA claim "real" GDP is up 2.6%.

That might be so, as "real" GDP is a concocted measure of dollar-named GDP deflated by using a past inflated GDP. In short, "real" GDP tells you nothing.

However, True GDP, which shows you reality, reveals that GDP has returned to decline mode. True GDP gets calculated by removing the effects of inflation.


Q4 2014 GDP is quite a let down considering that in Q3 2014, True GDP per industry worker was  up noticeably from a likely bottom in Durable Goods, Financial Activities and especially the Finance and Insurance sub-sector, as well as in Transportation and Warehousing, reflecting that production of property in capital had been far advancing production in wealth, which is always a good sign of a smooth running economy.

Yellen and her predecessor, Bernanke have done much to prolong the agony of the long, slow depression, the reckoning that followed the Greenspan-Bernanke Inflation Bubble, the biggest credit bubble in mankind's history. Quantitative Easing is exactly opposite of what Americans need.

Suppressing interest rates and thus cheapening credit kills the the return to capital for those with extant capital paid for with credit at higher rates borrowed upon expectation of higher prices.  This has resulted in unnecessarily lengthened, high unemployment followed by capital growth restriction and thus true wage growth impairment.

The fixed investment in capital equipment looks hideous still.


BEA workers shall force us to wait until February 27, 2015, for the second estimate for fourth quarter GDP.


Read more ...

Thursday, December 18, 2014

SPOTLIGHT TAIWAN. TRUE GDP. EWT.


The Taiwanese have experienced their first true economy growth since Q3 2013 and the first growth of size since the time betwee Q2 2009 and Q4 2010.


With 21 years of GDP and cash exchange rate data, measured by quarters, the Taiwan economy has grown 59.5% of the time and has shrunk 40.5% of the time.

The longest growth streak lasted fifteen quarters between Q4 1993 and Q2 1997. The longest decline stretch lasted nine quarters between Q1 20111 and Q1 2013 matching an alike decline one other time.

True GDP hit a peak Q1 2008. From the peak to the True GDP low hit Q1 2014, True GDP declined -8.9% a year, falling a full -30.1% over six years.

Since the low, True GDP has grown 1.7% growing at the yearly rate of 3.4%.

After hitting a low in January 2009, True EWS has grown 18.3% from the bottom, growing at a yearly rate of 0.3%. With 17 and ½ years of data, for 53.6% of the time, EWS has been up and for 46.4% of the time, EWS has down months.


After hitting a low in January 2009, True EWT has grown 17.9% from the bottom, growing at a yearly rate of 0.3%. With 17 and ¾ years of data, for 47.1% of the time, EWT has been up and for 52.9% of the time, EWT has been down.
Read more ...

Thursday, December 4, 2014

AT LONG LAST, BANKERS ARE ADVANCING CREDIT

Adding more proof to the reality of the USA economy at long last advancing, True Loans and Leases have begun to advance.

Here is what True Loans and Leases looks like compared to True GDP.


True Loans and Leases is up 3.14% and growing at the yearly rate of 6.6%. As can be seen, from the peak of True Loans and Leases hit during Q4 2007, True Loans and Leases fell -44.7% falling at a rate of -8.4% a year over 6 and ¾ years.

True Loans and Leases has advanced 13.8% of the time over the last 56 years, with 56.7% of the quarters as up quarters and 42.9% of the quarters as down quarters.

Keep in mind that today's True Loans and Leases falls between Q1 1997 and Q2 1997. Americans have far to go to grow to the previous peak GDP. Likely, that growth will take years.

The longest growth streak started by the end of Q1 1994 and ended by Q3 1997 lasting 15 quarters. The longest decline stretch started by Q4 1990 and ended by Q1 1994 lasting 11 quarters.

In THE USA ECONOMY ADVANCE LIKELY HAS BEGUN AT LONG LAST, I show that growing Private True GDP has lifted True GDP growth over the last two quarters.

If you are an investor, whether in the businesses of others or for your own business, it looks like now is the time to undertake capital expenditure for the likely forthcoming consumer advance fueled by an employment expansion over the coming quarters and years.

It would take a war or significant disaster to derail what is shaping up to be an advance at this point.

Even the yield rate curves look positively normal. You can see those in HEY "YIELD CURVE" WATCHERS. TRUE YIELD RATE CURVES LOOK NORMAL.

Now what are bankers going to do with all of those excess reserves.
Read more ...

HEY "YIELD CURVE" WATCHERS. TRUE YIELD RATE CURVES LOOK NORMAL.

All too often, many get sloppy with the words of their language and thus confusion sets in. This seems to be true of those who work in the financial world.


There is a difference between the words yield and rate. A yield is a sum of payment. A rate is a ratio of a measured quantity over time.

When you hear someone talking about the "yield curve," what that one should say is rate curve or yield rate curve.

A curve is a line drawn from data, plotted as rise or fall over run.  A yield rate curve is drawn from bond yield rates of maturities arranged in sequence from short-term maturity to long-term maturity.

So why is the yield rate curve important? 

In the normal state of affairs, investors are less certain about the future than nearer to now. Investors are willing to pay for bonds only at much lower prices than par for bonds with longer maturity.

Said another way, investors buy higher yield rates for longer futures. In short, investors want to pay less for the yield offered since the longer the time, the greater the danger they will lose all they have put at risk.

In an abnormal state of affairs, many believe bad times are soon ahead. Since investors are less certain about the short-term relative to the long-term, investors are willing to pay for bonds much lower prices than par for bonds of short maturity.

Said another way, investors buy higher yield rates for shorter futures. Investors want to pay less for the yield offered since the shorter the time, the greater the danger they will lose all they have put at risk.

So what does the current True Yield Rate Curve look like, the curve plotted after removing the effects of inflation?


What did it look like six months ago?


How about a year ago, what did the true yield rate curve look like a year ago?


How about the curves leading up to Peak GDP of Q4 2007, what do those curves look like?


That is an inverted yield rate curve! As you can see, the rates for short maturities of six months and one year are much higher than those for longer maturities.


Yes, that is an inverted yield curve too.


And this curve above also is an inverted yield curve.

Before Greenspan and Bernanke kicked in the last phase of the biggest inflation in the history of mankind, then peak True GDP hit at the end of Q4 2000. What did the True Yield Rate Curve look like in the months preceding that peak?


There is an inverted yield curve yet again.


And here is one more inverted yield curve.

Some define the "yield curve" as the difference in yields between two-and 30-year U.S. Treasury bonds. Even with that limited segment of the yield rate curve, the 30 less 2 Popular Yield Curve has inverted 112 quarters from 454, which is 24.7% of the time over that almost 38 year span.

The last time the Popular Yield Curve inverted happened on February 1, 2007. The longest streak of inversion for the Popular Yield Curve ran between 2002 through 2006 through the last leg of the Greenspan-Bernanke Inflation.


Be sure to read THE USA ECONOMY ADVANCE LIKELY HAS BEGUN AT LONG LAST, which I published yesterday, if you desire to get in on the bottom on what could be booming USA economy ahead.
Read more ...

Wednesday, December 3, 2014

THE USA ECONOMY ADVANCE LIKELY HAS BEGUN AT LONG LAST


Although blogging as all know it began around 1999, blogging didn't take off until 2004. With a growing economy, many jumped on the financial blogging bandwagon, including the pessimists and other associated cranks.

Since Banking crisis of 2008 caused by the massive inflation undertaken by former Federal Reserve central bankers Greenspan and Bernanke, these perpetual downers and cranks have earned their  their readership by bashing the Federal Reserve and its figureheads (Janet Yellen, William Dudley, Richard Fisher) as well as Wall Street, its major commercial banks, its major financial banks and their figureheads.


Along the way, bloggers have coined anti-establishment heroes, who, in truth, are part of the establishment such as Elizabeth Warren, the former egghead from academia and the current a senator from Massachusetts. As well, these bloggers stick together in an unwritten alliance, referencing each other's published works. For more on Elizabeth Warren, you can read all you ever need to know about her right here on Bizarro Theater: POOR-MINDED ELIZABETH WARREN NEEDS HELP WITH REALITY, THE REALITY OF TRADE, PROPERTY AND PROFIT.

Most amusingly, many of these cranks and perpetual downers have peddled buying gold, you know, in case the zombie apocalypse, or at least the banking version of that comes.

Like everything else, gold rose in price fueled by buyers flush with credit along with the massive inflation fueled economy.

Peak GDP hit Q4 2007. Gold buyers were slow to catch that signal, so slow in fact they kept buying until March of 2008. And then as deflation began of the Greenspan-Bernanke Bubble, the biggest credit bubble in the history of mankind, true gold fell right with it.


True gold didn't resume its price run until it became clear Americans were experiencing a banking crisis. That price run began in December 2008. True Gold continued to rise until hitting a true peak in September 2011.

Since then True Gold has fallen and has fallen hard. True Gold is down -50.2% having fallen at a rate of -19.8% a year.

With that performance, it should be clear that gold is a bad bet. If you have greater curiosity, check out my work right here on Bizarro Theater, IS THERE EVER REASON TO BUY GOLD?

All the same, here is what the True GDP picture looks like for the USA.


The most recent low in True GDP happened this year, in Q1 2014. From peak True GDP until the most recent low, True GDP fell -41.8%, falling at a yearly rate of -7.7%.

Since hitting that Q1 2014 low, True GDP has grown 2.52% growing at a yearly rate of 5.2%.

Only in four quarters — Q2 2008, Q4 2009, Q2 2010, and Q2 2013 — was there any growth in True GDP over the preceding quarter.

Looking at the next chart, you can see that Public Sector True GDP crossed over Private Sector True GDP in Q1 2009. That is never good for the economy.

In the great, long, slow deflation of the Greenspan-Bernanke Inflation, the longest decline stretch happened over the 11 quarters between Q3 2010 and Q1 2013.


Even more telling is this chart. The right end of the chart shows growing Private True GDP has lifted True GDP growth over the last two quarters.


It's looks like it is time to become optimistic about the economy. If I were a betting man, I would bet the reckoning is over. Enough individuals and firms have righted themselves. It is time for true growth, sustained growth.
.
It should be noted by everyone the earth over that neither the U.S. Congress nor central bankers of the Federal Reserve did anything to cause the economy to recover. No one can take credit for fixing the economy after almost seven years.

Those who do are liars. Those who claim others have fixed the economy are little better than toadies.

If only the Federal Reserve would publish Commercial Clearings on a timely basis. Then we would have confirmation of sustained True GDP growth.

For more on the importance of Automated Clearings, check out THE SECRETS OF AUTOMATED CLEARINGS, GDP AND THE ECONOMY. RECOVERY? WHEN? right here on Bizarro Theater.
Read more ...

Friday, November 14, 2014

POLITICIANS AND TV BLABBER HEADS HAVE LIED TO YOU FOR YEARS ABOUT THE ECONOMY. SEE THE TRUTH.

In THE SECRETS OF AUTOMATED CLEARINGS, GDP AND THE ECONOMY. RECOVERY? WHEN?, I showed you how bank clearings of checkable deposits between two parties strongly correlates with GDP once you remove the effects of inflation. As you know GDP is the measures the economy.


To further show you there hasn't been any recovery, I give you these confirming charts.

Bank credit comprises about 71% of all banking activity as measured by assets bankers declare on their books. Consumer activity comprises 11.1% of all banking activity. Residential realty of both  closed-end residential loans and  bortgage-backed securities comprises 20.6% of all banking activity. Producer activity comprises 22.2% of all banking activity.

Bank credit to Producers consists of Commercial and industrial loans as well as     Commercial real estate loans. Bank credit to Consumers consists of  Consumer loans as well as Revolving home equity loans.


The consumer pictures do not look so good. Since hitting a peak at the end of Q1 2010, true consumer loans have fallen -29.4%, falling at a rate of -5.6% a year.


True Home equity line of credit (HELOC) loans peaked at the end of Q3 2008. Since then, HELOCs have fallen -58.9%, falling at a rate of -13.8% a year.


Combined, true bank credit to consumers peaked at the end of Q4 2007. Since the peak, bank credit to consumers has fallen -43.6%, falling at rate of -12%.


The producer pictures do not look much better. True commercial and industrial loans peaked at the end of Q3 2008. Since then, true commercial and industrial loans have fallen -44.9%, falling at a rate of -9.4% a year.


True commercial real estate loans peaked at the end of Q4 2007. Since then, true commercial real estate loans have fallen -51.8%, falling at a rate of -10.2% a year.


Combined, true bank credit to producers peaked at the end of Q3 2008. Since the peak, true bank credit to producers has fallen -49.6%, falling at rate of -10.8%.

If there is a glimmer of hope, that can be found in true commercial and industrial loans. Since Q4 2011, true commercial and industrial loans have grown 0.6%, growing at an annual rate of 0.2%.

We're living in the 21st century. Politicians need to stop lying about obvious reality. Central bankers and others need to acknowledge their hubris.

Politicians and central bankers don't know what they're doing and they never did. If they did, it wouldn't take six years to fix the economy.

It's quite eye-opening when at long last one grows up only to discover almost all adults mostly lie about everything and many adults are too stupid to know they repeat lies willingly for those who hold power over them.

Fictional-character Gregory House is right. Everybody lies.

Read more ...

Wednesday, November 12, 2014

FEDERAL RESERVE BANKERS HAVE INFLATED U.S. STOCKS, MAYBE 70% TO BEYOND 100%

For those who follow stocks and stock markets, all too often, you'll hear or read a one pundit or another say stocks are overvalued or stocks are undervalued. What never you hear these pundits say is stocks are overvalued or undervalued relative to what.


Many use the S&P 500 as the benchmark index. The S&P 500 tracks 500 large firms, which having common stock listed either through the New York Stock Exchange or through NASDAQ.

Often, you'll get comparisons of the  S&P 500 relative to the U.S. economy. Many believe the S&P 500 signals the near future of the U.S. economy. Should they, though?

Since 2003, revenues of S&P 500 firms earn outside the USA has averaged a bit more 45%. Said another way, S&P 500 firms earn 55% of their revenues from foreigners living in foreign lands. According to a 2011 Wall Street Journal story, "U.S. multinational corporations, the big brand-name companies that employ a fifth of all American workers ... employed 21.1 million people at home in 2009 and 10.3 million elsewhere."

On the face of it, the S&P 500 does not seem to be a good measure of the U.S. economy. What we would need to know is of the roughly 20% of American workers employed by S&P 500 firms, what percentage of total private sector income is the sum of their incomes.

Other indexes exist, like the S&P 400, which tracks stocks of firms total market capitalization that falls within $750 million to $3.3 billion. The Russell 3000 tracks stocks by market capitalization of 3,000 firms, which represent 98% of U.S. firms with publicly traded stocks.

The Russell 2000 tracks the bottom 2,000 stocks of the Russell 3000. The Russell 2000 represents only 8% of the total market cap of the Russell 3000. Said another way, the top 1000 firms of the Russell 3000 constitute 92% of the index.


As I showed in THE SECRETS OF AUTOMATED CLEARINGS, GDP AND THE ECONOMY. RECOVERY? WHEN?, no one should expect revival of the economy until true commercial clearings of banking transactions advance. No one should expect significant growth of the economy until true government clearings advance.
Read more ...

Friday, November 7, 2014

THE SECRETS OF AUTOMATED CLEARINGS, GDP AND THE ECONOMY. RECOVERY? WHEN?


Commercial banking. Commercial banking is what gives rise to any advanced economy. In spite of popular misguided hatred for bankers, without commercial banking, you would be living at a bare subsistence. Nothing that you know would exist — the Internet, smart phones, cars, pain killers, sports stadiums, TV.

A hidden aspect to the economy are the many transactions commercial bankers handle, which transfer checkable deposits between two parties — someone, a firm or government agency.

An automated clearing house (ACH) is a bank clearing house uses computers for inter-bank settlement of electronic credit and debit transfers of depository institutions. The Federal Reserve operates FedACH, the automated clearing house service of the regional reserve banks of the Federal Reserve.

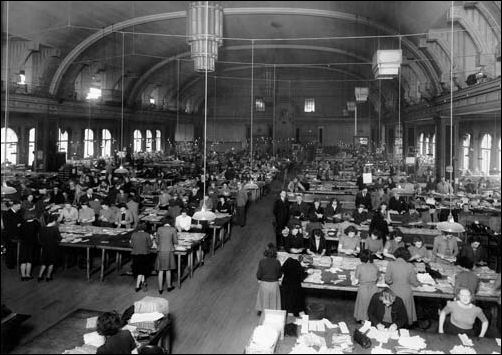
Bank Clearing During World War 2
FedACH handles direct debiting of consumer bills such as mortgages, loans, utilities, insurance premiums, rents; one-time debit transfers of converted checks, debt cards over the Internet and telephone calls; direct credit transfers such as deposit of payroll, Social Security welfare, other government welfare, tax refunds; tax payments to federal, state, and municipal governments; payments made to vendors of federal, state, and municipal governments.

Until True Commercial Clearings begin to rise, no one should expect the economy to be sound. Until True Government Clearings begin to rise steadily, no one should believe an expansion is under way.

Here is what True GDP looks like compared to True FedACH clearings.


Here is what True GDP looks like compared to True FedACH government clearings.


And here is what True GDP looks like compared to True FedACH commercial clearings.


First, here is a general observation. During GDP growth, commercial clearings and government clearings grow. The government clearings growth rate far outstrip commercial clearings growth rate during true GDP growth as political coffers get fat from unearned shares of profits, otherwise known as taxes.

Now, let's look at the true clearings during true GDP growth years and decline years.

Beginning Q4 1988 off Reagan Low of Q3 1987 to Bush 1 Peak (Q3 1990), True GDP grew 5.9%, growing at a yearly rate of 2.91%. True Commercial Clearings grew 18.2% growing at a yearly rate of 8.7% and True Government Clearings grew 40.6% growing at a yearly rate of 18.6%.

From the Bush 1 Peak to Clinton Low (Q3 1990 to Q1 1994), True GDP shrank -14.8%, shrinking at a yearly rate of -4.2%. In spite of contraction, True Commercial Clearings grew 14.8% growing at a yearly rate of 3.7% and True Government Clearings grew 23.6% growing at a yearly rate of 5.8%.

So, how could the economy shrink while commercial clearings and government clearings grow? Technological advance could account for the former. Mandated new taxes in the face of Read My Lips could account for the latter.


From the Clinton Low to Clinton Peak (Q1 1994 to Q4 2000), True GDP grew 51.4%, growing at a yearly rate of 6.1%. True Commercial Clearings grew 81.8% growing at a yearly rate of 8.9% and True Government Clearings grew 191.9% growing at a yearly rate of 16.5%.

The Clinton Good Times, from the Clinton Low to Clinton Peak truly were good times for wage earning Americans. Back in EVERYBODY'S WORKING FOR THE WEEKEND, FOR LESS, I showed that during the Clinton Low to Clinton Peak,  Americans experienced True Private Wage Income growth for any stretch since the years between Johnson and Reagan.

In S&P 500 AND THE DOW JONES INDUSTRIAL AVERAGE HIT ALL-TIME LIES!, I showed how the True S&P 500 hit the all-time high back on August 28, 2000, when the S&P closed at $313.35 in True Dollars™. Between December 5, 1994, and the all-time high hit on August 28, 2000, the True S&P 500 grew 261.9% growing at a blistering rate of 25% a year. Likely surprising to many, over those 2,094 days, or 5 years, eight months and 24 days, cash and deposits fell -6%, falling at an annual rate of -1.1% and leaving cash and deposits $69.7 billion less than before the start of the run.

In, True State of the Union: Wage-Earners' Income and Taxes, I show during that 1994 and 2000 stretch, as a percent of GDP, true private wages rose. As well, true average income rose, employment incidence rose and hit an all-time peak, and true individual taxes as a percent of GDP rose, nearing the all-time high.

Contrast the Clinton Good Times with the Bush 2 Low to Bush 2 Peak between Q3 2003 to Q4 2007. During the Bush 2 Illusion Economy, fueled by the Greenspan-Bernanke Credit Bubble, the biggest inflation in world history, True GDP grew 17.9%, growing at a yearly rate of 3.5%, a bit more than half the rate of the Clinton Good Times. True Commercial Clearings barely grew 2.8% growing at a yearly snail's pace of 0.6% and True Government Clearings grew 42.1% growing at a yearly rate of 7.7%.

After the blow up of the Greenspan-Bernanke Inflation of the Bush 2 Illusion Economy, a two-part decline hit. From Bush 2 Peak to the Obama Greenshoots (Q4 2008 to Q3 2009), GDP fell -18% falling at a yearly rate of -9.5%. True Commercial Clearings fell -15.9% falling at a yearly rate of -8.3% and True Government Clearings grew -17.4%% falling at a yearly rate of -9.1%.

And then the full on Obama Disaster (Q4 2009 to Q1 2014) hit thanks to Obama and his Congresses. During the Obama Disaster, True GDP has shrunk -29.6%, shrinking at a yearly rate of -7.5%. True Commercial Clearings have shrunk -25.6%, shrinking at a yearly rate of -6.4% and True Government Clearings have shrunk -37.9%, shrinking at a yearly rate of -10.0%.

Overall, since the Bush 2 Illusion Economy Peak through the Obama years and Obama disaster, True GDP has shrunk -42.2%, shrinking at a yearly rate of -8.1%. True Commercial Clearings have shrunk -37.9%, shrinking at a yearly rate of -7.1% and in lockstep with True GDP, True Government Clearings have shrunk -4.2%, shrinking at a yearly rate of -8.1%.

Looking at the year over year from Q1 2014 and the last two years also from Q1 2014, which is the last quarter for published data, the picture is ugly still. Over the last two years, True GDP has fallen -12.4% falling at a rate of -6.4% a year. True Commercial Clearings have fallen -14.5% falling at a rate of -7.5% a year. True Government Clearings have fallen -7.0% falling at a rate of -3.6% a year, this being the one glimmer of hope.

The one year picture looks alike. True GDP has fallen -7.0%. True Commercial Clearings have fallen -7.5%. True Government Clearings have fallen -1.6%. Again, this adds to hope.

Read more ...